# Planet Labs: Key Metrics and Trends
### Revenue Growth Trends
Planet Labs has demonstrated **steady revenue growth** in recent years. Annual revenues climbed from about **$96 million in FY2020 to roughly $221 million in FY2024**. This represents **more than a 2.3× increase over four years**.
Notably, **FY2023 saw a sharp jump** – full-year revenue reached **$191.3 million, up 46% year-over-year**. This acceleration **outpaced prior years** (for example, **FY2022 grew \~16% to $131M from $113M in FY2021**). The robust growth trajectory reflects **Planet’s expanding customer base and demand for its satellite imagery services**.
Such revenue trends position Planet **on a strong growth path**, building from **mid-eight-figure revenues a few years ago to over $200M+ annually by 2024**. This **upward momentum underscores investor expectations** that Planet’s “daily Earth imaging” model **can continue scaling revenues at a healthy clip**.
#### **Key Takeaway**:
Planet’s annual revenues have **risen consistently**, nearly **doubling from FY2020 to FY2024**. Recent fiscal years saw **particularly strong growth (45–46% YoY in FY2023)**, indicating a **robust growth phase post-IPO**.
***
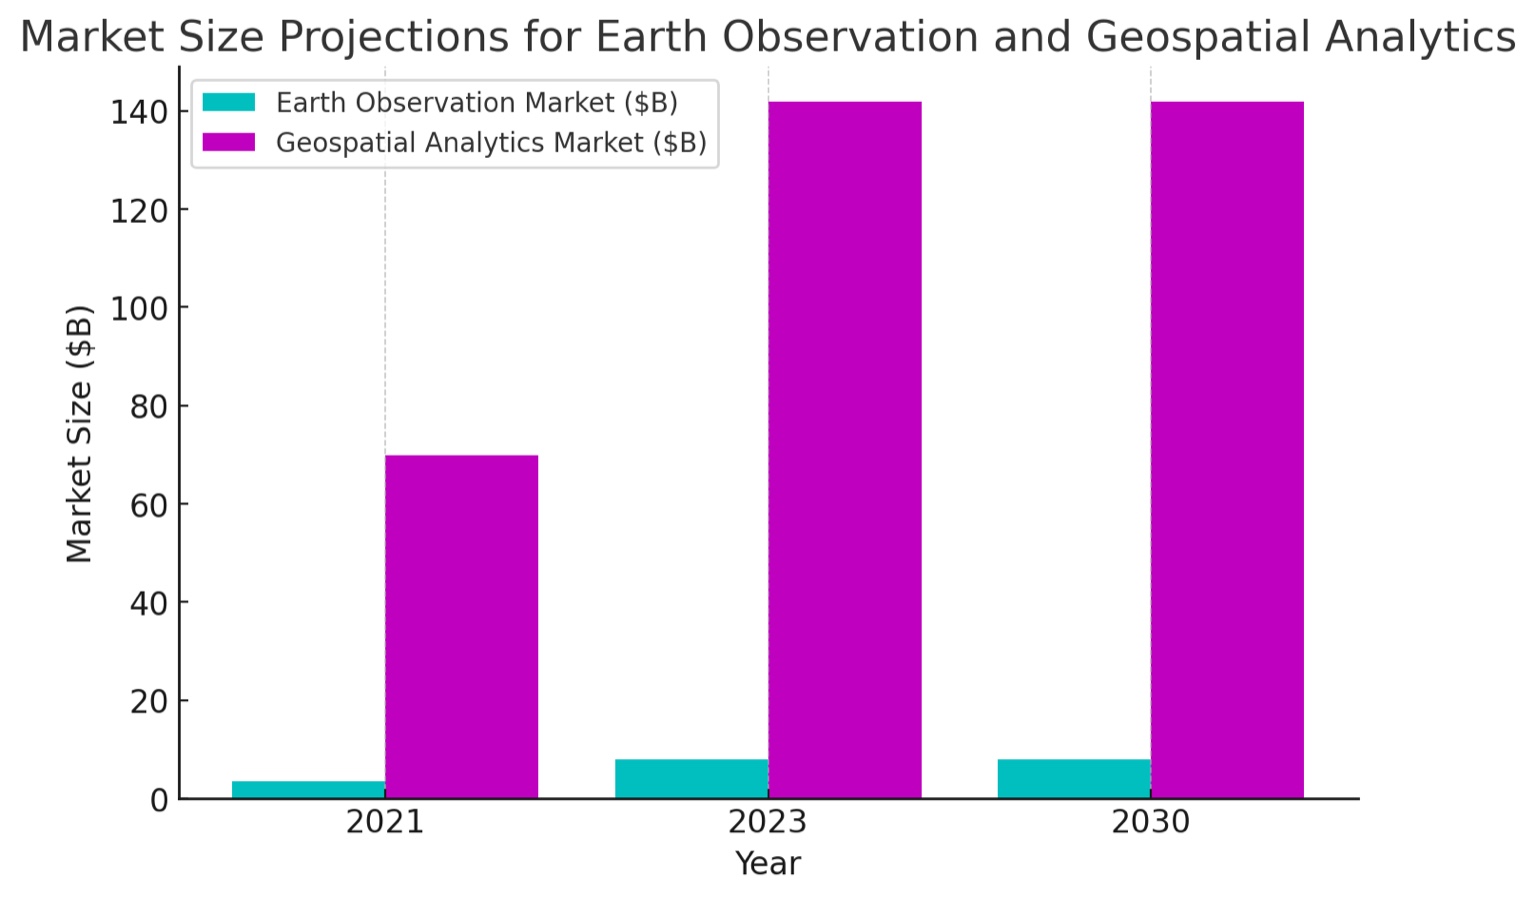
### Market Size Projections
The **broader Earth observation and geospatial analytics market** is projected to **expand significantly over the next decade**.
* The **global satellite Earth observation market** (focused on imagery/data) was valued at **$3.6 billion in 2021** and is **forecast to reach approximately $7.9 billion by 2030** – about a **2× increase (CAGR \~6.9%)**.
* The **geospatial analytics market** (including value-added analysis of location data) is **even larger**:
* Estimated at **$69.9 billion in 2023**
* Projected to **grow to \~$141.9 billion by 2030 (CAGR \~12.6%)**
**Multiple sources predict double-digit annual growth for geospatial analytics**, fueled by **increasing demand in sectors like agriculture, defense, climate monitoring, and infrastructure**.
Planet Labs operates **at the intersection of these markets** – providing **raw imagery as well as analytic platforms** – so a **growing industry tide is a positive indicator**. The **total addressable market (TAM)** Planet often cites encompasses **not just satellite imagery sales** but also **analytics and emerging applications** (e.g., **precision agriculture, environmental monitoring**).
#### **Key Takeaway**:
**Earth observation and geospatial analytics are booming markets**.
* Core **satellite imagery revenues may roughly double by 2030** (e.g., **$3.6B in 2021 → $7.9B by 2030**).
* The **broader geospatial data analytics sector** could **reach the tens of billions (> $100B) by 2030**.\
This **growth underpins a strong demand backdrop** for Planet’s services.
***
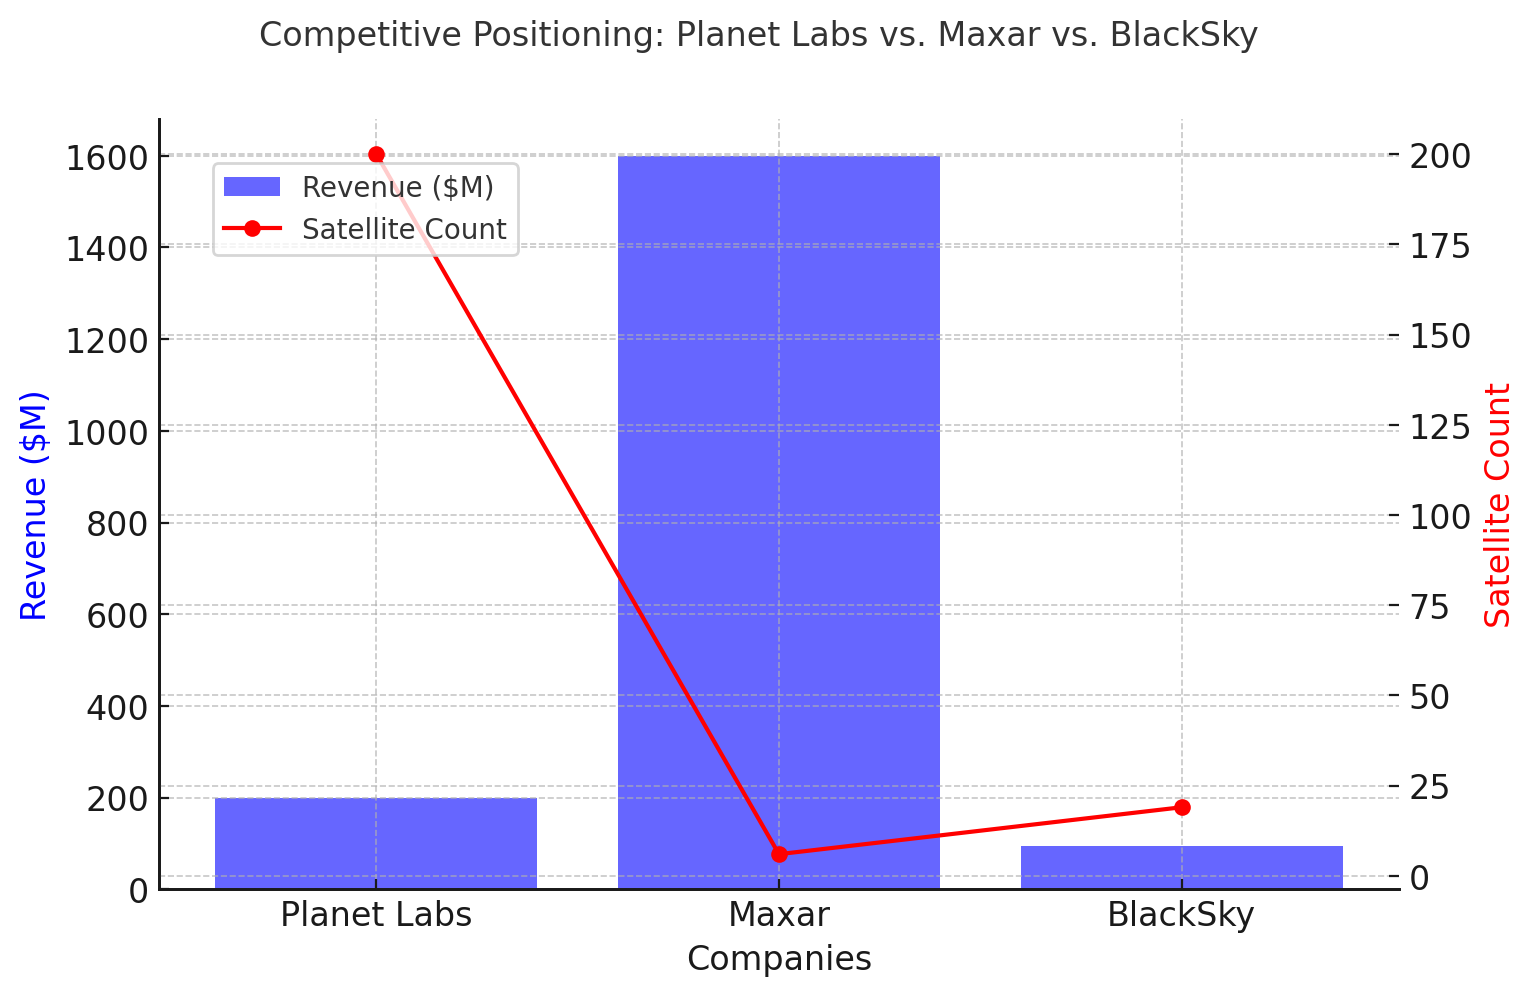
### Competitive Positioning
Planet Labs faces **competition from a mix of established and emerging players** in Earth observation:
* **Maxar Technologies** (which includes the legacy DigitalGlobe)
* A **longstanding leader** in **high-resolution satellite imagery**
* **Annual revenues \~$1.6 billion (2022)**
* Operates a **much smaller fleet** – traditionally only a **handful of large satellites** (e.g., the **WorldView series**).
* **Airbus Intelligence Division**
* Operates a **handful of optical satellites** (such as the **Pléiades Neo constellation**)
* Part of a **multi-billion-dollar aerospace portfolio**.
* **BlackSky**
* Operates **14–19 small satellites** focused on **rapid-revisit, high-cadence imaging**.
* **Revenues:** \~$65M in 2022, **$94M in 2023** (smaller than Planet).
* Competes **for similar contracts in defense and commercial sectors**.
#### **Key Comparisons:**
* **Planet Labs**: \~**200 satellites** (mainly **3–5m resolution Doves + 50cm SkySats**)
* **Maxar**: \~**5–6 active high-resolution satellites (30cm-class)**
* **Airbus**: \~**4–6 very high-resolution satellites (50cm or better)**
* **BlackSky**: \~**14+ satellites (1m resolution), with plans for 60+ in coming years**
Planet occupies a **middle ground** – a **mid-sized company by revenue** but **leading in sheer data collection capacity**. This **broad coverage is a competitive moat** that others are **hard-pressed to match without similar large constellations**.
***
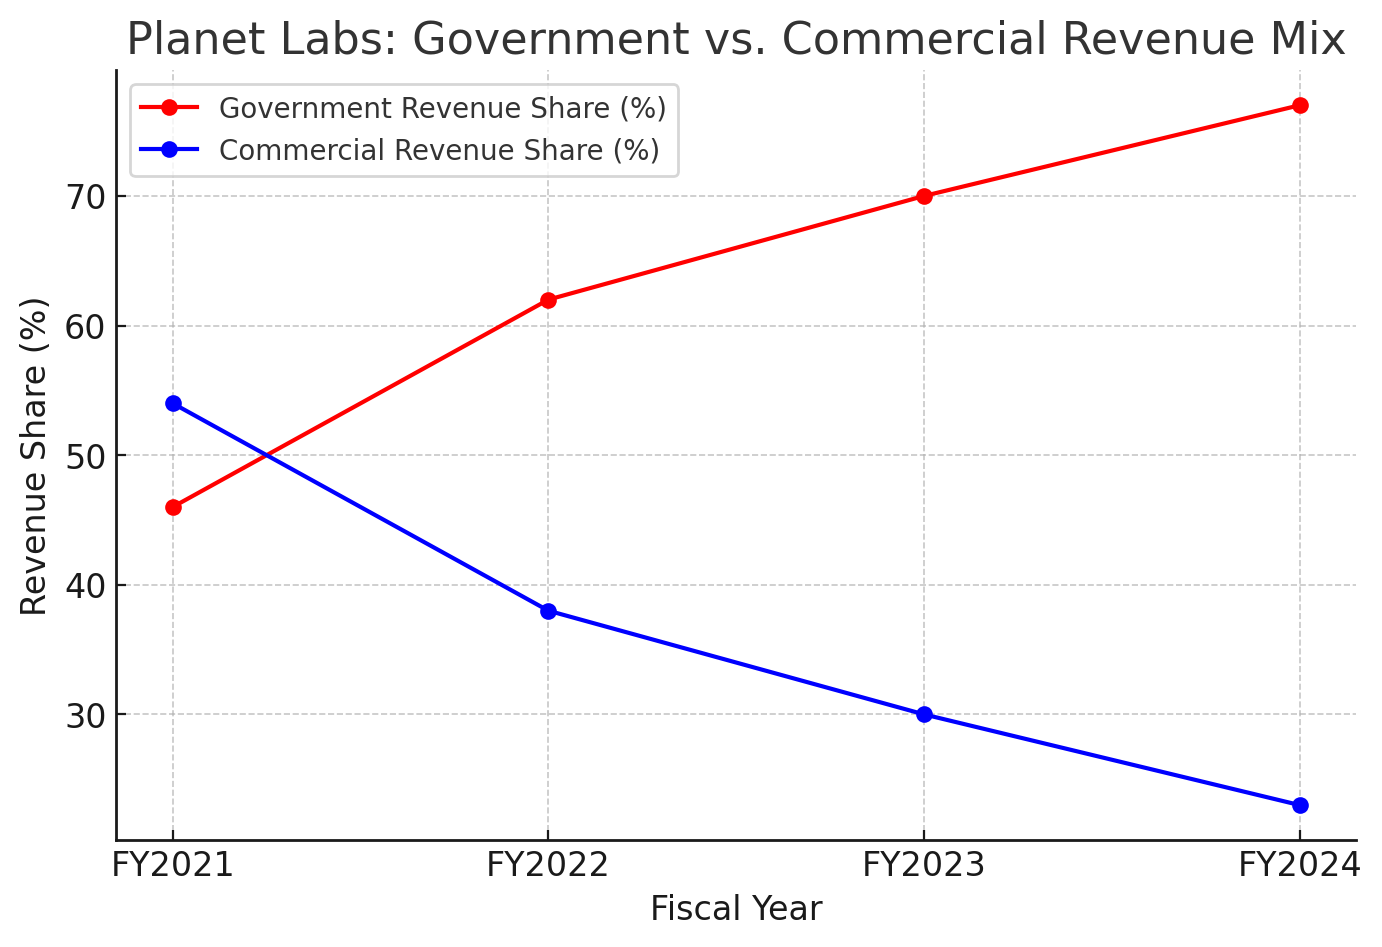
### Government vs. Commercial Revenue Share
Over time, **Planet’s revenue mix between government and commercial clients has shifted notably**.\
Initially, Planet **expected commercial customers** (agriculture, finance, insurance, etc.) **to make up a growing majority of its business**. However, the **opposite occurred – government sales have surged**.
As of **mid-2024**, only **\~23% of Planet’s revenue comes from commercial sectors**, meaning about **77% is from government (defense and civil) clients**.
#### **Key Takeaway**:
Planet’s **revenue mix has flipped to approximately 75% government vs. 25% commercial as of 2024**.\
This **marks a shift** from a **more balanced or commercial-heavy mix previously**.
***
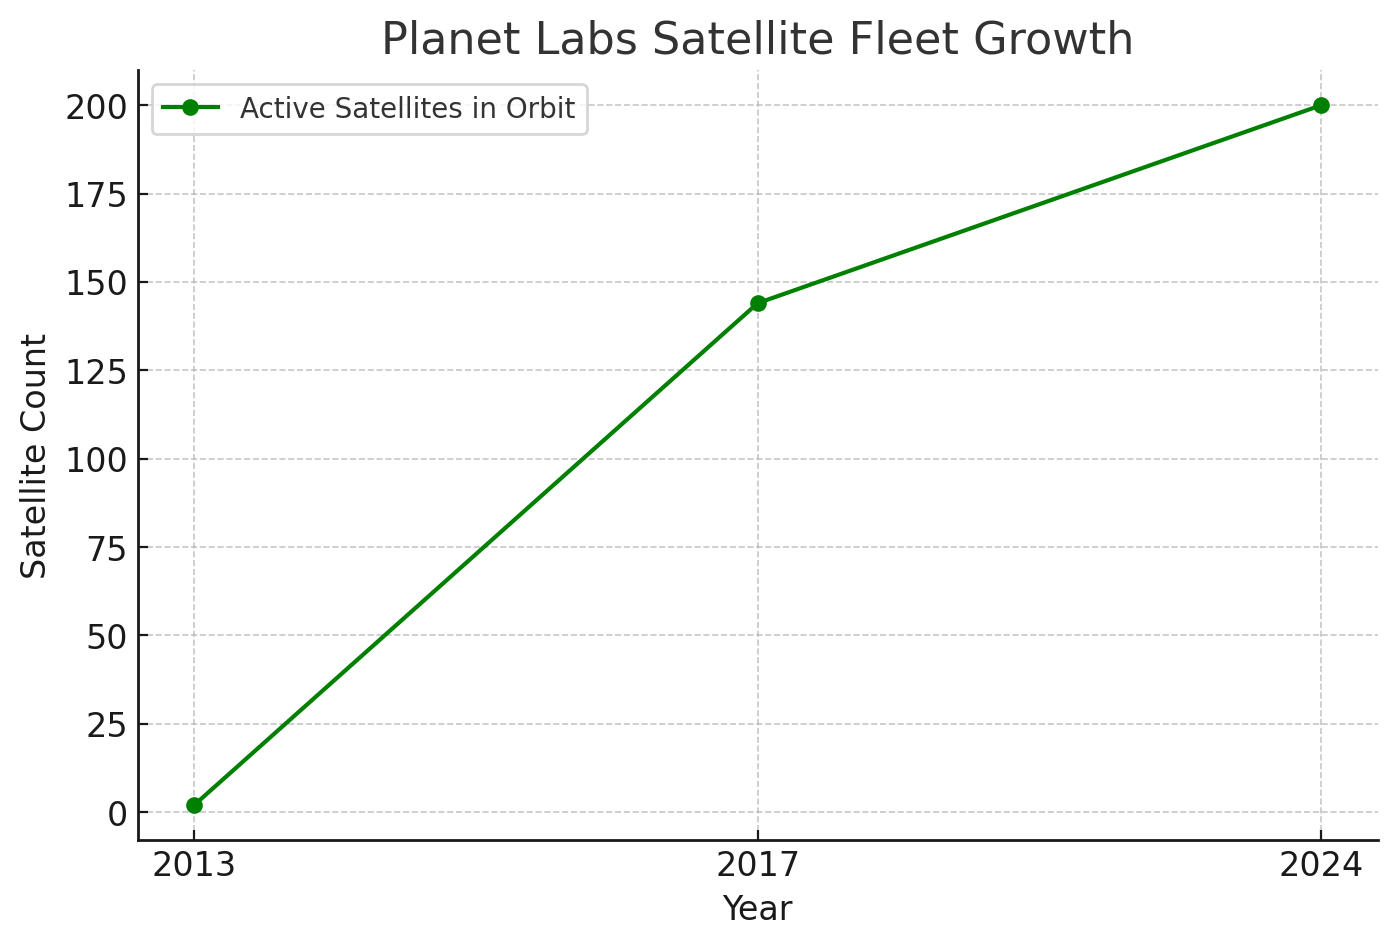
### Satellite Fleet Expansion
Planet Labs **operates the largest fleet of Earth observation satellites ever deployed**, and it has **expanded rapidly over time**.
* The company **started with just a couple of prototype CubeSats in 2013**.
* Launched its **first large batch of “Dove” nanosatellites in 2014**.
* By **2017**, Planet **made headlines by launching 88 Dove satellites on a single rocket**.
Fast forward to **today**, and Planet has **approximately 200 operational satellites in orbit on any given day**.
#### **Key Takeaway**:
Planet’s **satellite constellation scaled from a handful in 2013 to \~200 in orbit today**, with **500+ total satellites launched to date**.\
Regular launches **replenish and grow the fleet**, including **new high-resolution Pelican satellites**.
***
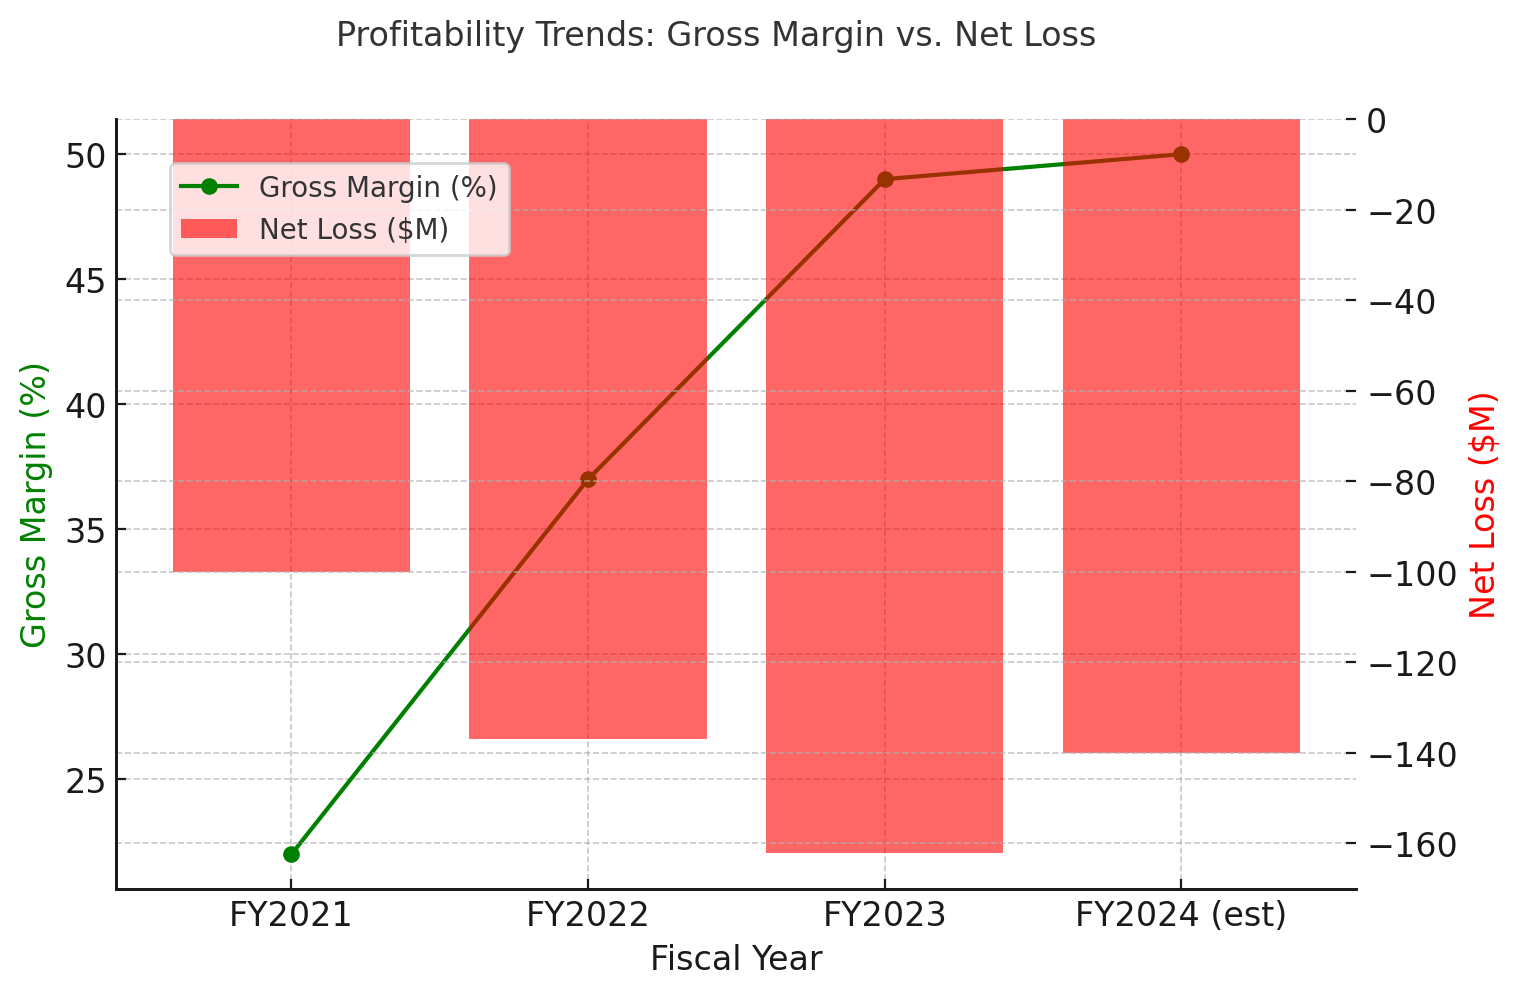
### Profitability Trends
Planet Labs **remains in a growth mode financially**, but **clear trends show movement toward improved profitability**.
One **major positive sign** is **gross margin improvement over the past few years**:
* **FY2021**: \~**22%**
* **FY2022**: \~**37%**
* **FY2023**: \~**49%**
* **FY2024 (est.)**: \~**50%+**
However, **Planet is still reporting net losses**:
* **FY2022**: **-$137M**
* **FY2023**: **-$162M**
* **FY2024 (est.)**: **-$140M**
Although **losses are substantial**, the **trendline is improving** as **revenue scales and operating expenses are managed**.
#### **Key Takeaway**:
* **Gross margins improved from \~37% to 50%+**, highlighting **better economies of scale**.
* The company still **incurs net losses (over $100M per year)**, but it is **using its cash to invest in growth**.
* **Adjusted EBITDA losses are expected to narrow** in coming years, signaling **progress toward eventual profitability if current trends continue**.